
Introduction
| Getting Started | Get Working |
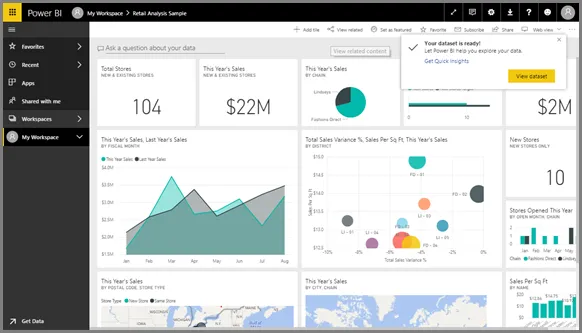
Power BI is a business analytics solution that lets you visualize your data and share insights across your organization, or embed them in your app or website. Connect to hundreds of data sources and bring your data to life with live dashboards and reports.
You can access Power BI at https://app.powerbi.com or from your list of available applications when logged into https://office.com.
Power BI at UT Austin
Power BI is free and available to all UT, using your M365 account, and enables access to all content and capabilities in the Power BI service, including the ability to share content and collaborate with other Power BI users. Users can publish to and consume content from app workspaces, share dashboards, and subscribe to dashboards and reports.
Power BI Pro is available to all current students, current and future faculty and staff with Microsoft 365 accounts at no additional cost. Simply log in to Power BI and get started.
Premium:
Power BI Premium is an additional cost. For questions regarding Premium licensing, reach out to office365@austin.utexas.edu.
Take a guided tour of Power BI>>
Getting Started
Navigation
Power BI consists of a Windows desktop application called Power BI Desktop, an online SaaS (Software as a Service) service called the Power BI service, and Power BI mobile apps for Windows, iOS, and Android devices.

Supported Browsers:
- Microsoft Edge
- Internet Explorer 11
- Chrome desktop (latest version)
- Safari Mac (latest version)
- Firefox desktop (latest version - Firefox may change the fonts used in Power BI reports.)
Power BI Content Types
All Power BI content exists in a workspace and comes in 5 building blocks:
- Visualizations: a type of chart built using data in reports and datasets Learn more>>
- Dashboards: a single screen with interactive visuals, text, and graphics. Data comes from one or more datasets Learn more>>
- Reports: one or more pages of interactive visuals, text, and graphics together Learn more>>
- Apps: sharable bundles of related dashboards and reports Learn more>>
- Datasets: containers of data like a file from Excel or a database
Get Working
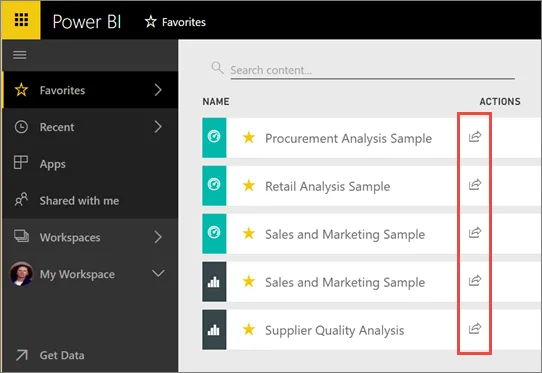
Sharing Content
Sharing is a great way to give others access to your dashboards and reports. There are several other ways to collaborate and distribute dashboards and reports, too.
With sharing, whether you share content inside or outside your organization, you need a Power BI Pro license. Your recipients also need Power BI Pro licenses, or the content needs to be in a Premium capacity.
|
Check out the latest post from Microsoft or find out about new features. |
||
| Microsoft 365 Blog | PowerBI Blog | What's New in PowerBI |

Which Tool When?